

The International Energy Agency’s new report on grids makes an argument that is easy to state and hard to sell: the cheapest new transmission capacity is the capacity already sitting in the wires. Its analysis puts the prize from grid-enhancing technologies at up to 330 GW of extra generation, storage and demand that could connect to existing networks without building anything — in months rather than years.
Modernising Grids in the Age of Electricity, published on 21 September 2026, is the IEA’s attempt to quantify a category of equipment and software that utilities have piloted for years without adopting at scale. The subtitle sets the scope: “Scaling digital technologies and AI for better use of existing networks.”
The context is not in dispute. Electricity demand has grown at roughly twice the rate of overall energy demand over the past decade, and meeting its expected growth to 2035 requires grid capacity to rise by at least 30% — equivalent to adding or replacing 25 million kilometres of lines, three quarters of it in emerging market and developing economies. Meanwhile, at least 1,700 GW of advanced-stage renewable projects and 600 GW of utility-scale batteries were waiting for a connection in 2025, and congestion cost an estimated USD 12 billion in the United States and EUR 4.3 billion in the European Union in 2024.
What the 330 GW Actually Consists Of
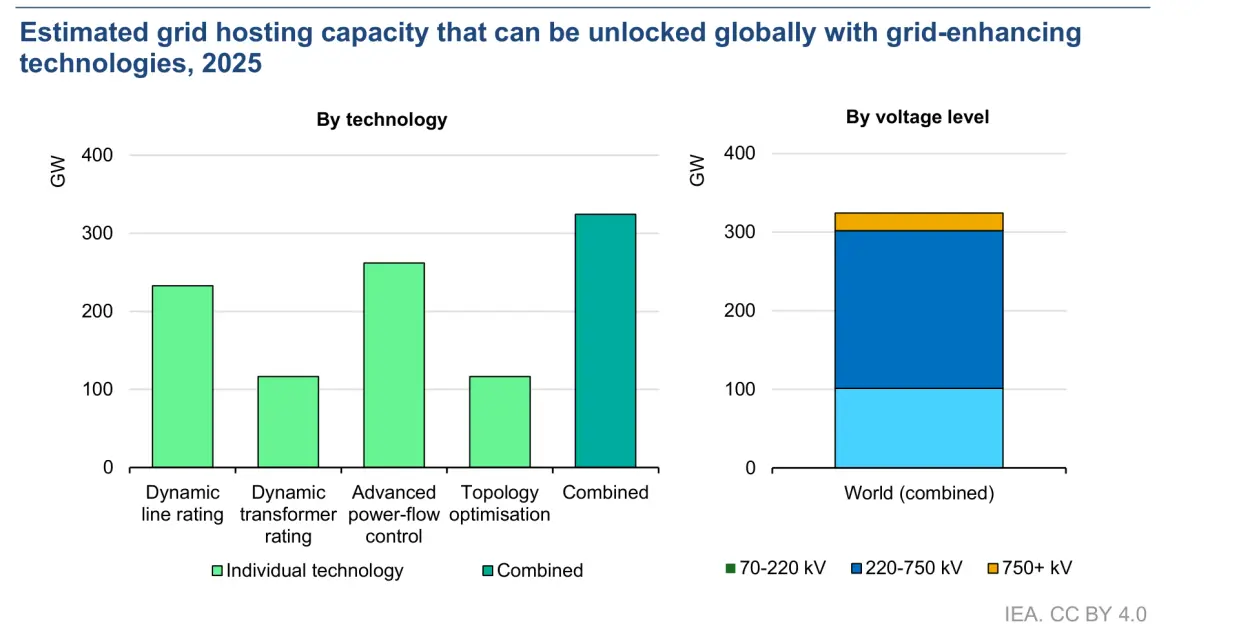
The figure covers the three technologies most widely deployed on transmission networks, and the IEA is careful to say other digital and grid-enhancing tools would add more.
| Technology | What it does |
|---|---|
| Dynamic ratings | Adjusts how much power lines and transformers can safely carry based on actual weather conditions, instead of a conservative static assumption |
| Topology optimisation | Reconfigures the network to route power around congested lines |
| Advanced power-flow control | Pushes power onto underused paths |
Three hundred and thirty gigawatts is roughly the combined installed generation capacity of France and Korea. The comparison the IEA offers is the cost one: connecting that volume through network expansion instead would require around USD 100 billion of investment. And it points out the obvious asymmetry in delivery times — most of these tools can be deployed in months, which means they relieve constraints while the steel is still being ordered.
One detail in the full report is worth carrying, because the headline hides it: 330 GW is the top of a range. The IEA’s estimate runs from 190 GW to 330 GW, reflecting different assumptions about how much extra capacity each technology delivers and how much of the network it can be deployed on with meaningful gains. The report states plainly that it uses “the upper end of that range as its headline figure”. On the IEA’s own modelling, then, 330 GW is the optimistic case, not the central one.
How the 330 GW Relates to the IEA’s Other Numbers
The report is a subset of earlier IEA work, and it says so. Its estimate is derived from the agency’s Electricity 2026 assessment, retaining only the technologies that fall within this report’s definition of grid-enhancing technologies. That earlier assessment found a combined global potential of 450–700 GW for a broader portfolio which also included storage as a transmission asset, reconductoring and voltage uprating. Restricting the scope to dynamic ratings, topology optimisation and advanced power-flow control produces the 190–330 GW figure.
A third category sits alongside both. Non-firm grid connections allow a generator, storage operator or large consumer earlier or larger access on the condition that output or consumption can be curtailed when the network is constrained. Electricity 2026 put that potential at 750–900 GW. Add the layers together — grid-enhancing technologies, physical upgrades and non-firm connections — and the IEA’s total is 1,200 to 1,600 GW of additional hosting capacity, against connection queues that now run into the thousands of gigawatts.
These are not substitutes, which is why the numbers do not simply add up in a headline. Grid-enhancing technologies increase how much power the network can safely carry; non-firm connections change when and how users may take it. In the report’s three-layer framework, the first sits in the network asset layer and the second in the flexibility layer — and the report analyses the first while leaving the second to other IEA work.
The Caveat the IEA Insists On: Some Congestion Is Efficient
This is the part of the report most summaries will skip, and it is the part that makes the rest credible.
The IEA states plainly that removing all congestion would mean sizing the grid for peak conditions at all times — and because wind, solar and many new loads run at full output only part of the time, such a network would sit well below capacity for most of the year. A degree of congestion is therefore efficient. Since network costs make up a substantial share of consumer bills, the question is not how to eliminate congestion but how to use what exists well enough that the remaining congestion is worth paying for.
That framing matters politically. Grid operators are routinely criticised for the size of their connection queues; the report’s response is that the queue is partly a pricing and risk-management problem, not only a construction shortfall. Operators hold margins below a network’s physical limits to cover risks they cannot fully observe, so better information lets those margins be narrowed safely. The same logic runs through the report’s treatment of AI: its value here is not autonomy but visibility — optimisation, forecasting, situational awareness and risk management, in the IEA’s phrasing.
The Evidence for Grid-Enhancing Technologies Is Already There
The report is not arguing from potential. It cites results already recorded in real networks: dynamic ratings producing around USD 64 million a year in avoided congestion costs in the United States; advanced power-flow control adding more than 2 GW of transfer capacity in Great Britain; and a digital twin — a detailed virtual model of the network — cutting the time needed to analyse reinforcement options by 70%.
Those are the kind of numbers that should travel. The IEA’s complaint is that they do not. Deployment remains highly uneven, and technologies proven at one site stall between pilot and standard practice, because each deployment has to justify itself from scratch in the absence of agreed methods for valuing the benefit or transferring the experience. Grid-enhancing technology deployment so far is concentrated in Europe and North America.
Why It Is Not Happening: People, Data, Trust, Rules
The report’s most useful data may be its survey of network operators on what is blocking them — and the answer is that almost nothing blocking them is technical.
| Barrier identified by surveyed operators | Share |
|---|---|
| Skills and organisational readiness | 64% |
| Availability and quality of data | 60% |
| Trust-related issues | 60% |
| Regulatory frameworks | 56% |
The skills answer has a hard edge underneath it. Professionals who combine power-system and digital expertise are scarce, and the grid workforce is ageing: the number of workers aged 55 and over rose by nearly 50% between 2015 and 2024, against 20% for those under 55. Recruitment alone will not fix that; the report argues for changing workflows so that proven tools become part of routine operations rather than permanent pilots.
On regulation, the diagnosis is a bias toward concrete. Operators often have clearer routes to deploy new physical infrastructure than to deploy a digital or operational alternative that addresses the same need — funding rules that do not favour capital spending, incentives tied to measurable outcomes such as capacity unlocked and congestion avoided, and credible ways to value system-wide benefits. Regulatory sandboxes and innovation funding are suggested as routes to build the evidence. Better data and visibility are most urgently needed at distribution level, where rooftop solar, electric vehicles and heat pumps are being connected faster than operators can see them, and where information that does exist often sits in incompatible formats across organisational silos.
The AI Paradox in the Report
AI appears twice in this story, and the two appearances pull in opposite directions.
First as demand: the data centres behind AI are a fast-growing load that can worsen the congestion the report is trying to relieve — the same pressure visible in the grid equipment being ordered for AI campuses. Then as tool: applied to energy systems, AI offers improvements in forecasting, inspection, maintenance and planning.
The IEA’s own figures show how far apart the two applications sit in practice. Among surveyed operators, 70% use AI widely for maintenance, but only 23% use it in real-time operations. The reason given is not capability but accountability: when AI informs safety-critical decisions, explainability, auditability and accountability requirements bind, and the operator remains responsible for the outcome. Planning and asset-management applications are described as relatively mature; operational control is where adoption stops.
What the Report Does Not Settle
Three limits are worth stating, because the 330 GW figure will travel further than its footnotes.
The capacity is bounded and variable. The IEA says outright that the capacity these tools release is limited by the physical network and changes with weather and system conditions, so they cannot deliver the step change that demand growth requires. Where conditions are favourable they can defer or avoid individual reinforcements — that is the claim, and it is narrower than “330 GW of new grid”. The model behind the number covers high-voltage networks of 70 kV and above as of 2025 and deliberately excludes system-specific constraints: voltage limits, fault levels, substation capacity and local generation-load patterns, all of which the IEA says require detailed network studies. It is a technical potential, not a connection offer.
Storage and demand-side flexibility are elsewhere. Both are routes to higher network utilisation, but the report treats them as complementary topics covered in other IEA work, with non-firm connections placed in a separate “flexibility layer” of its three-layer framework and analysed in other IEA publications. This document — which leaves the demand side, including vehicle-to-grid and megawatt-scale charging loads such as flash-charging networks, outside this document.
No technology-by-technology cost curve. The USD 100 billion figure is produced by converting the estimated hosting capacity into an equivalent length of avoided transmission line and pricing it against representative unit construction costs. The report does not publish a cost per gigawatt for each technology, nor a deployment timeline for any of them. For an investor or a regulator deciding what to fund first, that is the missing table.
AI gets no number of its own. The report is explicit that AI can improve how grid-enhancing technologies are targeted and operated — sharper forecasting, faster screening, better remedial-action analysis — but that its contribution cannot be estimated separately, and that this analysis “does not quantify a separate AI uplift”. The 330 GW, or rather the 190–330 GW, is a figure for the hardware and control technologies, not for the intelligence applied to them.
Sources & Further Reading
- IEA — “Modernising Grids in the Age of Electricity: Scaling digital technologies and AI for better use of existing networks” (published 21 September 2026, CC BY 4.0) — the report’s scope, framing and digital grid toolkit.
- IEA — executive summary of the same report — the headline figures: the 330 GW estimate, the USD 100 billion comparison, the 30% capacity and 25 million km figures, the connection-queue and congestion-cost numbers, the recorded results in the United States and Great Britain, the survey of operator barriers, the workforce data and the 70% / 23% split on AI use.
- IEA — “Modernising Grids in the Age of Electricity”, full report, 94 pages (2026-09-21, CC BY 4.0) — Chapter 3 supplied the 190–330 GW range, the 450–700 GW comparison with Electricity 2026, the 750–900 GW non-firm connection figure, the modelling assumptions and the statement that no separate AI uplift is quantified.
- IEA — “Electricity 2026” (September 2026). The Modernising Grids report derives its estimate from this assessment and restricts it to three technologies; the broader 450–700 GW portfolio also includes storage as a transmission asset, reconductoring and voltage uprating, and the 750–900 GW non-firm connection figure and the 2,500 GW-plus connection queue come from the same publication, which we have not read in full.
- EVsays — related coverage: grid equipment ordered for AI campuses, China’s vehicle-to-grid target, BYD’s 10,000th flash charging station and utility-scale storage investment.
Accuracy note: All figures, quotations and characterisations of the IEA’s position in this article are taken from the report itself, which we read in full, including the Chapter 3 methodology and its assumptions. The IEA’s estimate for grid-enhancing technologies runs from 190 GW to 330 GW and the report states that it uses the upper end as its headline; we quote 330 GW because that is the IEA’s own headline figure, and the range is disclosed above. We have not re-run the model or verified its network data, so the number remains an IEA calculation, and the 1,200–1,600 GW total and the 450–700 GW and 750–900 GW components originate in the separate Electricity 2026 assessment, which we have not read in full. The technology descriptions in our table paraphrase the IEA’s wording. The survey percentages, the workforce data and the 70% / 23% split on AI use are the IEA’s, drawn from its survey of network operators; we have not seen the underlying questionnaire or sample. The 2,500 GW connection-queue figure belongs to a different IEA publication, “Electricity 2026”, and is labelled as such in the text. Where we describe a limitation — the absence of a cost per gigawatt, or the treatment of storage and flexibility as out of scope — that is our reading of the document, not a statement by the IEA.
Sourcing note: The primary source is the IEA’s report and its executive summary, read directly. No other outlet’s framing was used for the substance. The analysis and the selection of which findings to foreground are EVsays’ own; the report is published under a CC BY 4.0 licence. Our standards are set out in our editorial policy and errors are handled under our correction policy. Images: the chart is reproduced from the IEA report under its CC BY 4.0 licence.